From Camera to Insights: What Blaxtair Connect Actually Delivers
Blaxtair Connect goes beyond real-time alerts to give safety and operations teams the data they need to drive lasting change. By transforming every detected risk into actionable insights, like heatmaps, alert trends, and fleet-wide KPIs, it helps you identify dangerous patterns, measure improvements, and prioritize interventions. It’s how smart safety moves from reaction to prevention.
Importantly, those “detected risks” aren’t limited to pedestrian alerts. In many sites, meaningful prevention also requires visibility into vehicle-to-vehicle risk and impact events. That’s why Blaxtair Connect can centralize and trend multiple safety signals, so you’re improving people safety, traffic safety, and asset protection with one analytics layer.
The Problem with “Beeping Cameras”
Alerts stop incidents, but insights fade after the shift.
Without data, you can’t prioritize zones, justify budget, or prove ROI.
A beeping system may prevent a close call in the moment, but it can’t answer the questions safety leaders get asked every week:
- Where are the repeat-risk areas we should fix first?
- Which shifts, aisles, or routes drive the most exposure?
- Are we reducing near-misses month over month, or just getting “used to the noise”?
- What evidence can we bring to leadership, audits, and insurers?
Forklift safety analytics solves the visibility gap between “we got an alert” and “we reduced risk.”
What Blaxtair Connect Captures (and Why It Matters)
Blaxtair Connect turns real-world safety activity into structured, reviewable signals, so you can detect patterns and manage risk like an operational KPI.
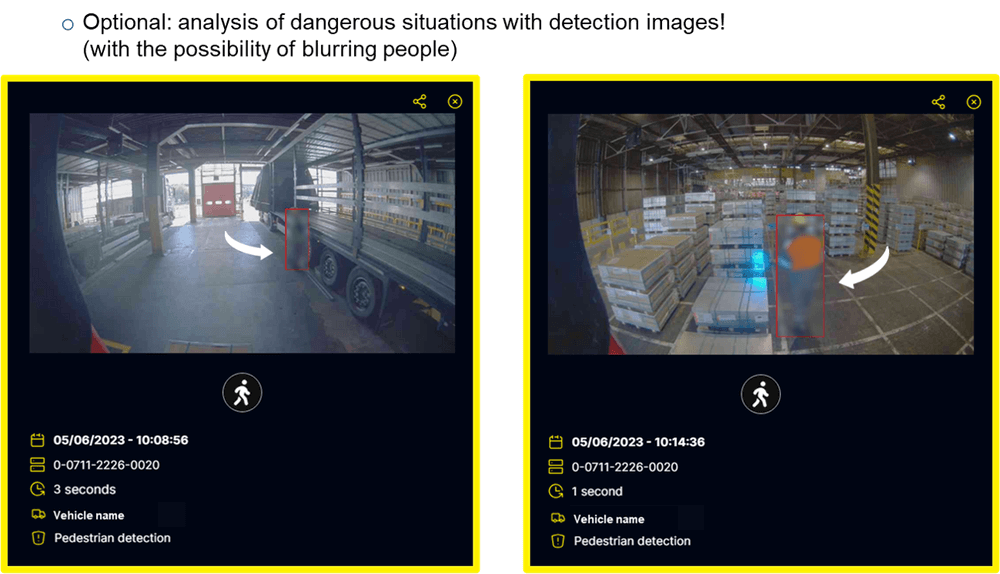
Event-level signals (what happened):
- Pedestrian-in-risk alerts by vehicle, time, and zone.
- Vehicle detection / vehicle proximity risk events (useful for congestion, crossings, shared lanes, yards).
- Shock / impact detection events (helpful for racking strikes, dock impacts, bumps that precede damage or downtime).
Context signals (why it keeps happening):
- Frequency patterns (peaks by shift, day, seasonality).
- Repeat-risk locations (specific aisles, dock approaches, intersections).
- Exposure concentration by vehicle type or route.
Outcome signals (is it improving):
- Near-miss and risk trends you can track month over month.
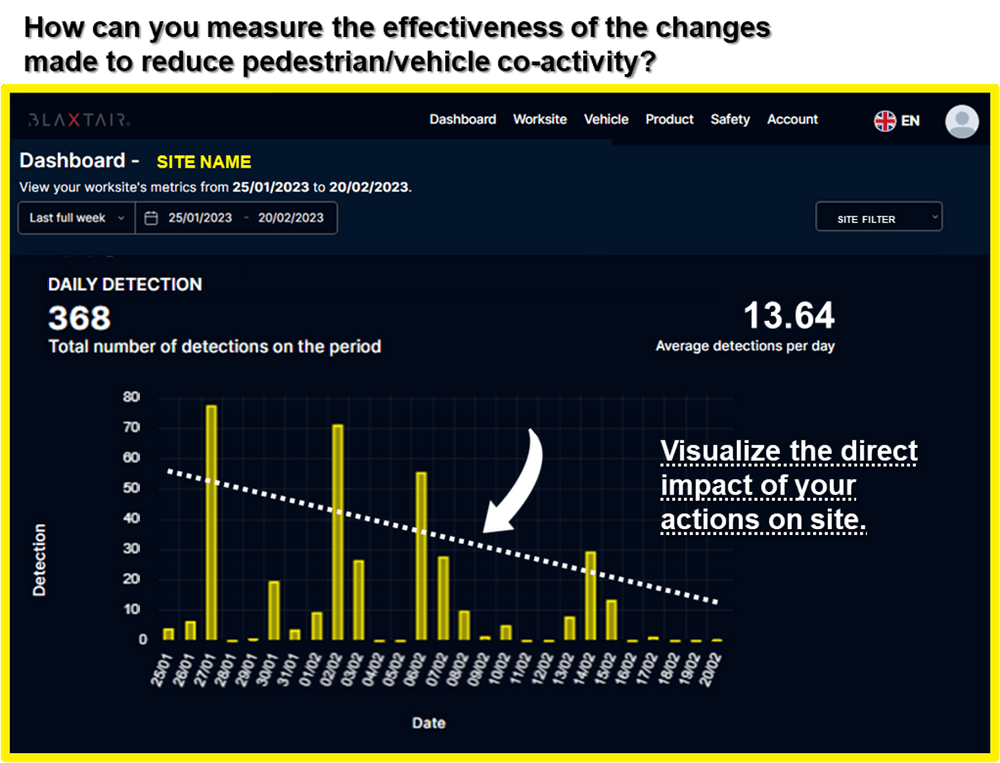
- Before/after comparisons following interventions (layout changes, training, routing, signage).
Privacy by design:
- Detection is on-device; analytics are focused on risk events, not identity.
- The goal is prevention insight, not surveillance.
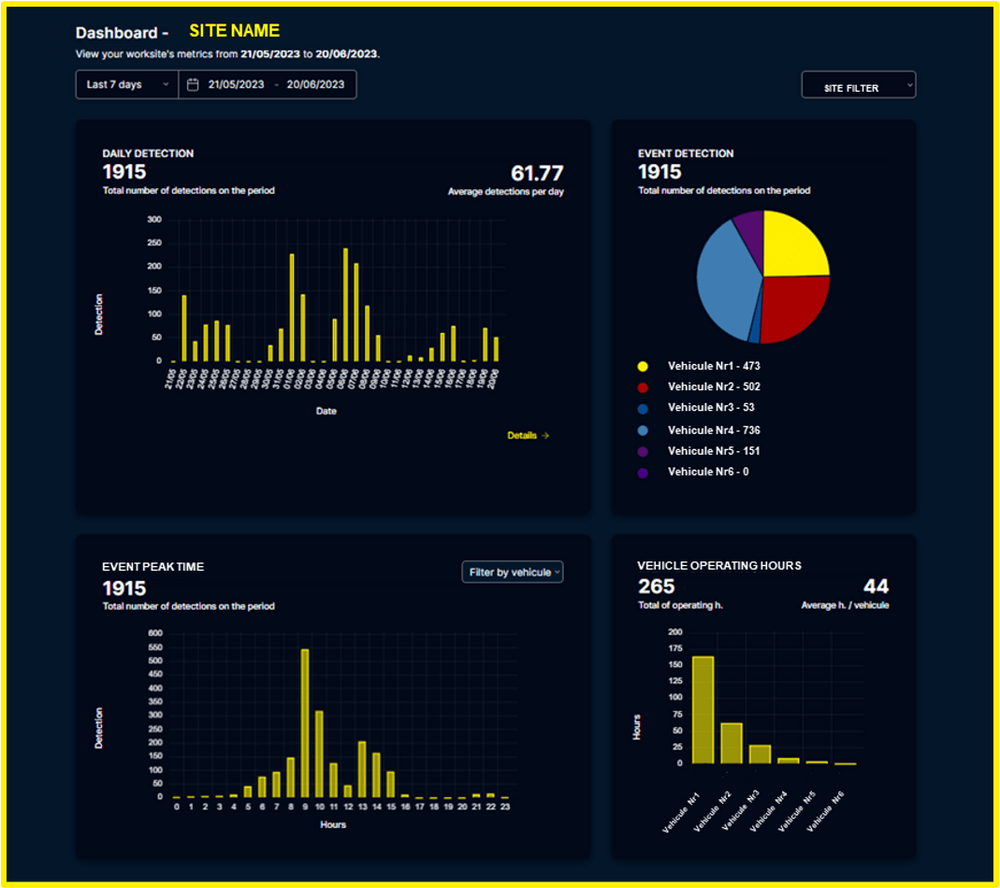
Dashboards & KPIs Safety Teams Care About
Forklift safety analytics only work if the outputs match how safety and ops teams run reviews.
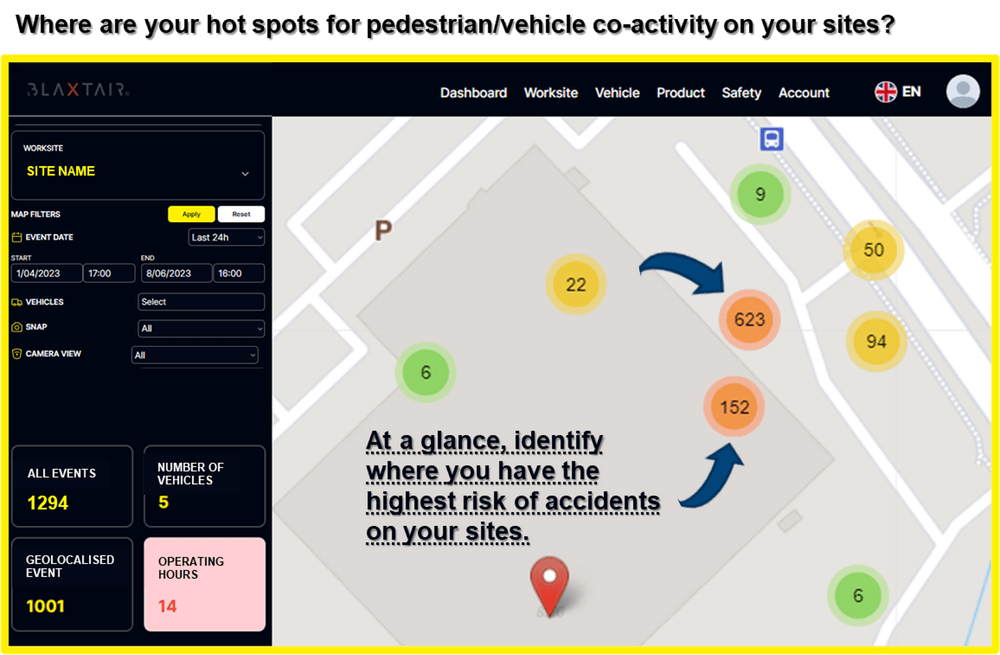
Risk Heat Patterns
- Pinpoint recurring hotspots by aisle, dock, staging zone, or yard.
- Add context: is it pedestrian exposure, vehicle congestion, or repeated shock events in the same area?
Fleet KPIs
- Alerts per 100 operating hours (normalized exposure).
- Vehicles with highest exposure (coaching priority).
- Vehicle-traffic risk indicators (where interactions spike).
- Shock frequency by vehicle / zone (maintenance + infrastructure signals).
Site KPIs
- Before/after comparisons for layout changes, policy updates, routing changes, or speed management.
- “Did it work?” becomes a dashboard answer, not a debate.
Exec roll-ups
- Simple metrics for CFO/COO: trend direction, risk reduction, and payback signals.
- Clear monthly snapshots for leadership reviews.
Turning Insights into Action (Continuous Improvement Loop)
This is where forklift safety analytics creates lasting change.
1. Identify hotspots from patterns
Use heatmaps and trend views to find repeat-risk zones and recurring conditions (specific intersections, peak times, certain routes).
2. Intervene
Choose the right lever for the pattern you see:
- Training refresh (targeted, not generic).
- Signage, barriers, mirrors, pedestrian separation.
- Routing changes (one-way aisles, staggered crossings).
- Operational policies (speed limits, dock procedures).
- Field-of-view tuning by vehicle class and site reality.
3. Validate improvements with 30/60/90-day trend lines
Confirm whether exposure rates drop and remain stable.
4. Scale changes across similar sites and vehicle types
If one facility fix works, replicate it across sites with similar layouts and fleets.
Proving ROI with Data (Not Assumptions)
Risk reduction is real value, but leadership wants evidence.
With Blaxtair Connect, you can:
- Map risk reduction to avoided incidents, downtime, and damage.
- Tie forklift safety analytics to insurance discussions and compliance reporting.
- Use shock event trends to support asset-protection ROI (less racking damage, fewer repairs, fewer “mystery impacts”).
- Use vehicle-risk trends to justify traffic redesign that also improves throughput.
Practical outputs that teams actually use:
- Export KPI snapshots for monthly safety councils and board reviews.
- Standardize scorecards across multi-site operations.
IT, Security & Compliance: How Data Is Handled
Blaxtair Connect is designed to support safety objectives without creating privacy or security risk.
- On-device detection; analytics are event-focused, not identity-focused.
- Role-based access so the right teams see the right level of detail.
- Retention policies aligned to safety objectives and audit needs.
- GDPR/CCPA-friendly deployment with worker notices & DPIA support as needed.
(Your IT and EHS stakeholders get an implementation that’s easier to defend internally, because it’s built around safety events and governance).
Implementation: From Pilot to Multi-Site Rollout
A clean rollout is how you turn analytics into adoption.
Start with a 30-day pilot
- Establish baseline metrics (pre-intervention reality).
- Align on alert taxonomy (what you track + how you interpret it).
- Capture operator feedback early (trust and usability matter).
Configure zones and displays per vehicle class
- Forklifts, loaders, terminal tractors, etc. have different workflows and exposure profiles.
- Tune zones for the environment (aisles vs docks vs yard).
- Include additional signals where relevant (vehicle risk + shock/impact).
Operationalize weekly reviews; automate monthly KPI reports
- Weekly: spot emerging issues and quick wins.
- Monthly: leadership roll-ups and formal safety council reporting.
- Standard templates make multi-site comparisons possible.
Conclusions
Blaxtair Connect transforms momentary alerts into continuous, site-level risk reduction, with the KPIs leaders need to invest confidently.
Book a live Blaxtair Connect demo.
FAQs
What are safety analytics?
Safety analytics help organizations identify potential risks before incidents occur by analyzing historical data and patterns, so teams can take proactive steps to prevent accidents and injuries.
Can we integrate safety KPIs into our existing reporting tools?
Yes. Export event and trend data to your BI or EHS platforms to align with existing safety dashboards and monthly review packs.
How quickly will we see actionable insights?
Most sites surface clear patterns within the first 2–4 weeks (repeat zones, shifts, or vehicle types). Use these to prioritize interventions and validate improvements in 30/60/90-day windows.